Water management
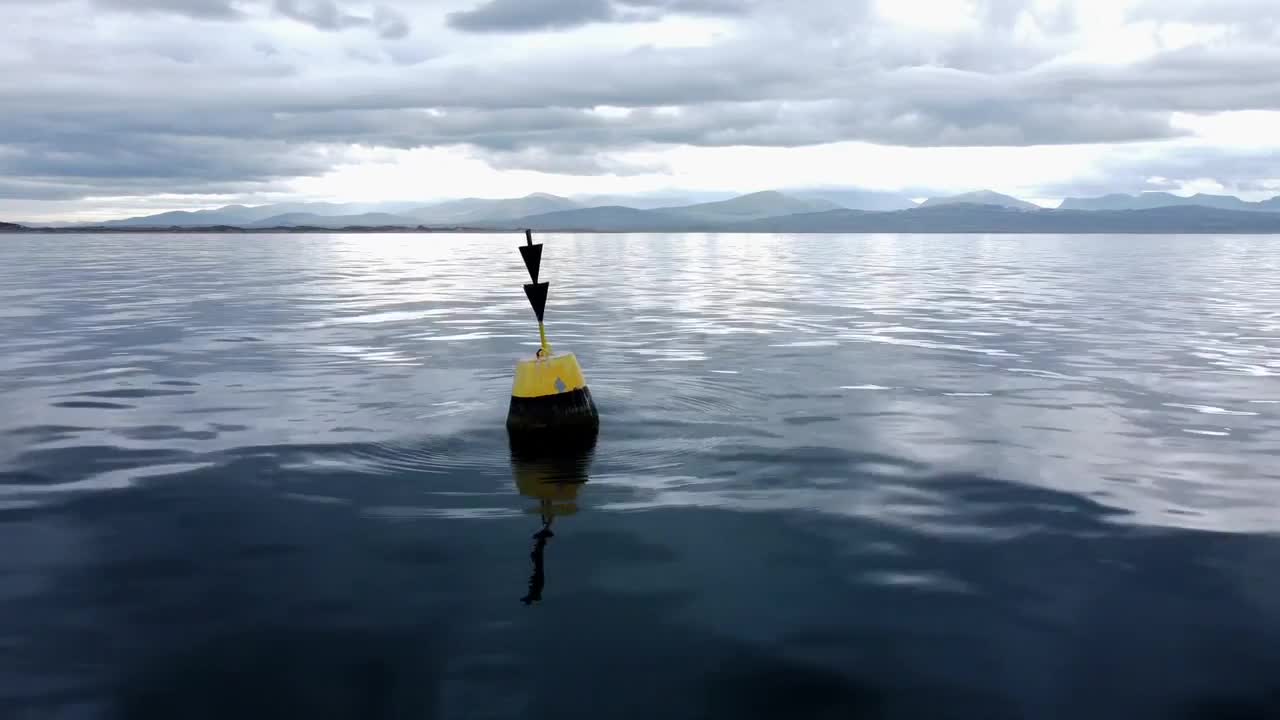
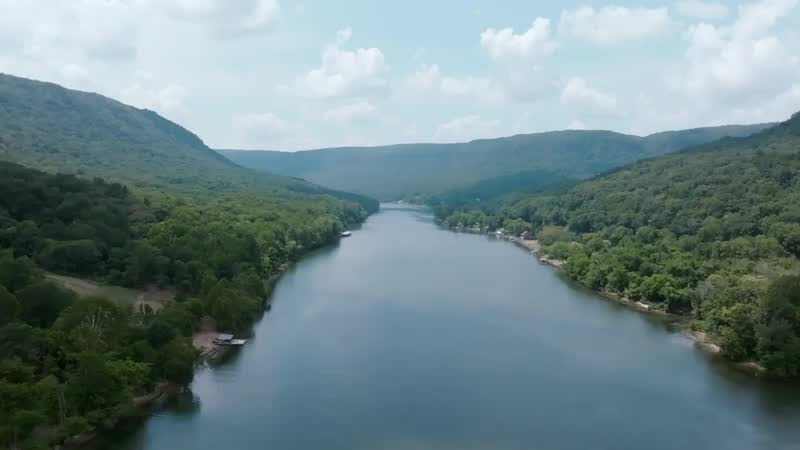
Rivers, groundwater, catchments, stormwater.
One instrument per point. Readings on the schedule the site needs: daily, or hourly when flow changes.
PFAS first.
Water treatment
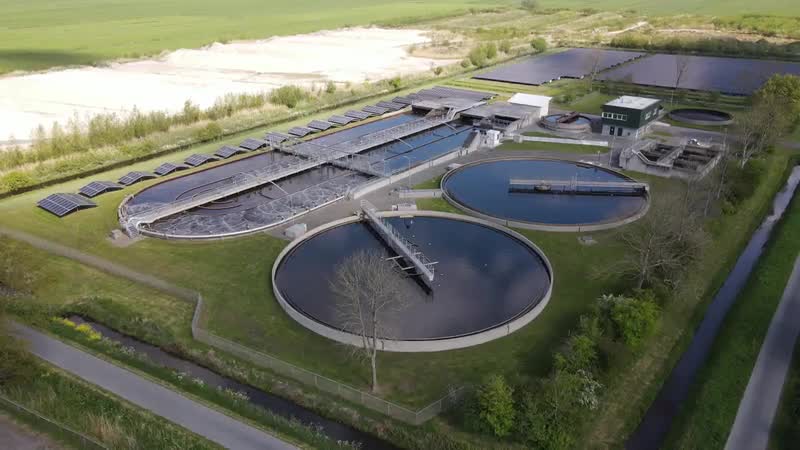
Drinking water and wastewater works.
Intakes, process stages and outlets measured on the same schedule, with the same method.
Compliance samples continue. Evertrace shows what happens between them.
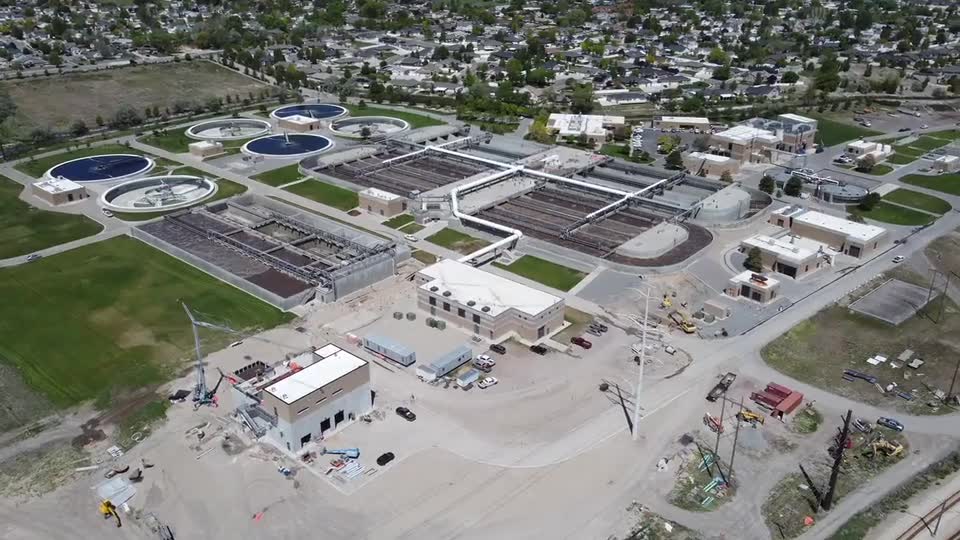
A drinking-water works with six intake points.
One PFAS reading per point per day, hourly during storms. Results on a dashboard, by alert and by API.
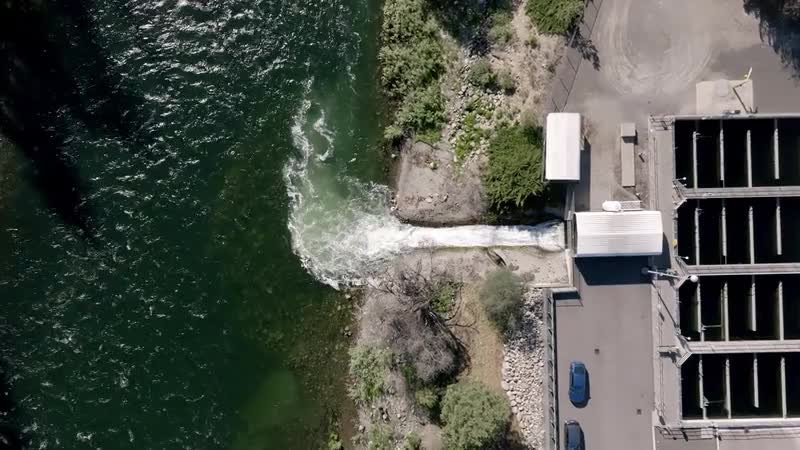
Site monitoring
Outfalls, contaminated sites, foam sites.
Instruments at the outfall, upstream and downstream. Readings through storms and dry periods, without a visit.
Data that shows when a site releases, and how much.
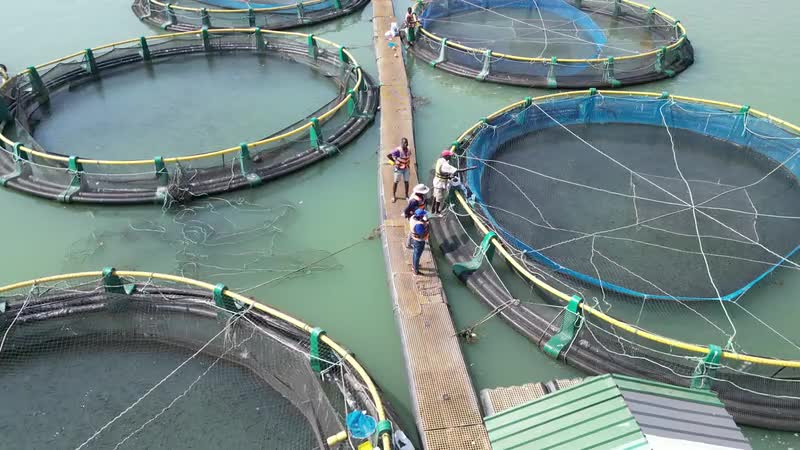
Aquaculture and aquariums
Fish and seafood farms, public aquariums, marine parks.
Water chemistry and pathogens in pens, ponds, tanks and recirculating systems, measured on the schedule the animals need.
Welfare of water-bred animals: nitrate, pathogens and algal toxins read before they become losses.
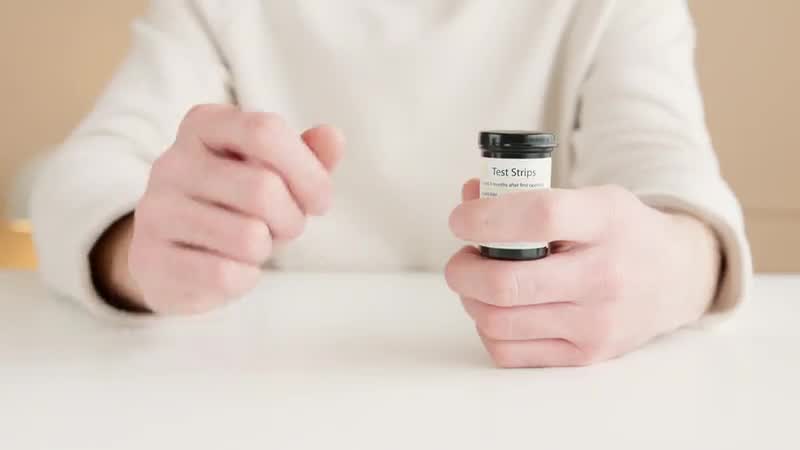
Human health
Home and remote clinical testing.
The same sensor films and reader, used at home. A sample on a film; the reading is sent to the clinician.
What daily readings show that a dozen bottles do not.
Cape Fear River, North Carolina
Sampled daily to weekly for two and a half years. PFAS below a fluorochemical plant averaged 143 ng/L and ranged from 40 to 377 ng/L. With river flow, the load ranged from 459 g to 17.3 kg per day.
Published river study, 2022
Wastewater treatment plant, Melbourne
Sampled every hour for a week. Daily average PFAS ran from 89 ng/L on Monday to 173 ng/L on Friday, with PFOS pulses to 400 ng/L lasting up to three hours. The authors calculated seven to nine bottles a day to see the variation.
Published wastewater study, 2023